The drive that started this
As someone who drove a 2007 Honda Accord for years, I noticed after a bit that I was more on-edge when an SUV or truck was in front of me. Not being able to see past them or even through their windows like I could with other sedans and cars like mine really changed the way I had to drive. I started driving a RAV4 a couple of years ago, and realized how much easier driving was again since I could see so much more. And this got me wondering if this lack of visibility for smaller cars and the rise in larger, taller vehicles has led to cars causing more wrecks.
That is the felt experience. The mechanism is plausible: a sedan driver behind a tall vehicle cannot see the traffic two cars ahead. They lose the early warning that another driver's brake lights would otherwise give them. If that mechanism is real, it should show up as cars rear-ending tall vehicles more often as SUVs and pickups took over the road.
What IIHS already measured
The Insurance Institute for Highway Safety (IIHS) has a forward-visibility study that lines up almost perfectly with my anecdote. They measured the share of road area a driver can see from the seat for many model-year vehicles. The 2003 Honda Accord scored about 65 percent. The 2023 Honda Accord scored about 60 percent. Basically unchanged. The 1997 Honda CR-V, which is the same family as the RAV4 I now drive, scored about 68 percent. The 2022 CR-V scored about 28 percent.
So the sedan I used to drive sees roughly the same amount of road today as it did twenty years ago. The compact SUV class I now drive sees less than half of what its 1997 ancestor saw. Worth calling out what those numbers actually measure: IIHS is scoring the SUV driver's view forward, not the sedan driver's view past the SUV. But the same physical changes that block the SUV driver's view (taller hoods, taller A-pillars, taller beltlines) also block the view of any sedan driver sitting behind that SUV in traffic. The tailgate of a 2024 CR-V is taller than the tailgate of a 1997 CR-V, and a sedan two cars back loses more of the road through the windshield than they used to.
And the sedan itself did not change. If driving the Accord felt worse in 2020 than it did in 2007, that is not because the Accord shrank. It is because the typical thing in front of it got taller. That is the mechanism this analysis was built to test.
The hypothesis, formalized
If car drivers cannot see past taller vehicles, they should rear-end them more often, especially after SUVs took over the fleet. The share of fatal car-on-tall-vehicle rear-end crashes should rise over time, faster than the share of car-on-car rear-end crashes, and that rise should hold even after accounting for the fact that there are simply more tall vehicles on the road. That is the trail of evidence I went looking for.
The data and approach
I used NHTSA's Fatality Analysis Reporting System (FARS), an annual census of every fatal traffic crash on US public roads since 1975. "Fatal" here means a crash where at least one person died within thirty days. I chose FARS for one practical reason: it is the most accessible long-running US crash dataset that has the body-type detail and time depth this question needs. Non-fatal crashes live in a separate sampled dataset (CRSS, 2016 onward) that would require survey-weighted estimation and a more complex analysis, so I left it out of scope here. The full pipeline (download, body-type crosswalk, five analyses, statistical helpers, and tests) lives in the companion repo at github.com/jvermaelen/cars-vs-suvs-crashes.
A note on the timeline. I show data from 1975 because that is when FARS starts, but I run regressions and quote slope numbers only from 2002 onward. Two reasons. First, 2002 was the year light trucks (SUVs, pickups, vans together) first outsold passenger cars in the US. It is the rhetorical line for "SUVs took over." Second, FARS body-type codes were reorganized in 1991, and even with my body-type crosswalk - a small translation table that maps each FARS era's body codes into a consistent set of categories (car, SUV, pickup, van, other) - repaired against the FARS Analytical User's Manual, the pre-2002 series has residual seams. Showing it for context is fine. Quoting a slope across it would be misleading.
The cohort throughout is "two-vehicle FARS rear-end crashes where the striking vehicle is a passenger car." Striking means the vehicle FARS lists as VEH_NO = 1, which is a useful but imperfect proxy for "the car that hit the other one." Lead vehicle is whichever was not the striker. "Passenger car" means sedans, coupes, hatchbacks, station wagons, and convertibles. "Tall vehicle" means SUV, pickup, or van. The five analyses below each cut that cohort a different way.
Analysis 1: Did car drivers start rear-ending tall vehicles more often?
This is the headline. For every year from 1975 through 2024, I take all FARS rear-end crashes where a passenger car struck another vehicle, and ask what share of them struck a tall vehicle. If the sight-line story is right, this line should slope up.
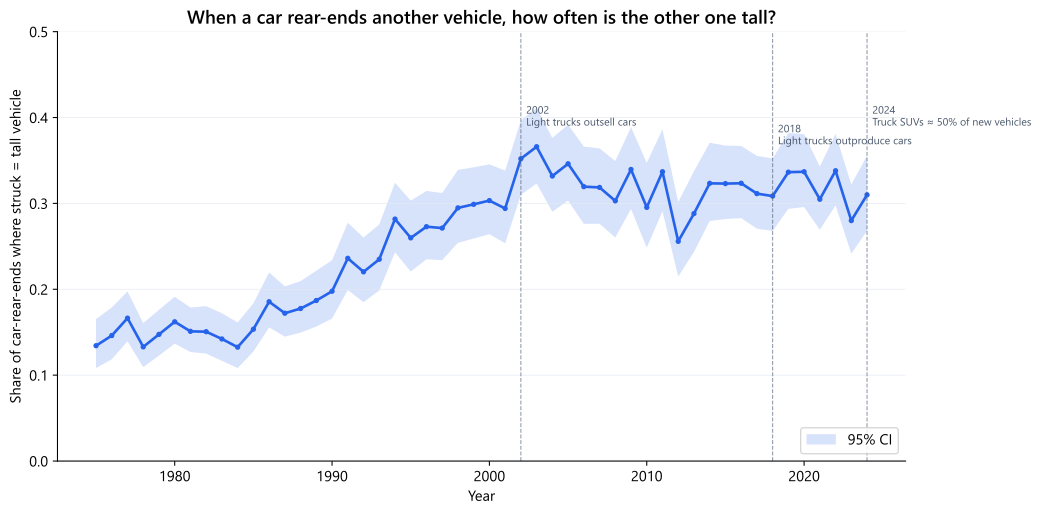
It does not. The post-2002 OLS slope is -0.131 percentage points per year, with a 95 percent confidence interval of [-0.287, +0.025] and a p-value of 0.0946. In plain language, the trend is flat. The share sits in a band of roughly 30 to 35 percent for the whole modern period. If anything the point estimate is slightly negative, which is the opposite direction the sight-line story would predict, but the confidence interval still covers zero and I am not going to make a claim out of a non-significant slope.
The honest tradeoff here: this is fatal crashes only. If the hypothesis predicts more low-speed fender-benders in parking lots that scare drivers but do not kill anyone, FARS will not see them. The natural extension is the Crash Report Sampling System (CRSS), the police-reported-but-not-necessarily-fatal sample. I might come back to it later, but it is not a commitment.
Analysis 2: Or did rear-ends just go up across the board?
A headline trend in isolation does not test much. The sight-line story has a specific shape. The share of cars rear-ending tall vehicles should rise faster than the share of cars rear-ending other cars. If both rose together, the story is just "more rear-ends in general" and nothing about sight lines is doing any work.
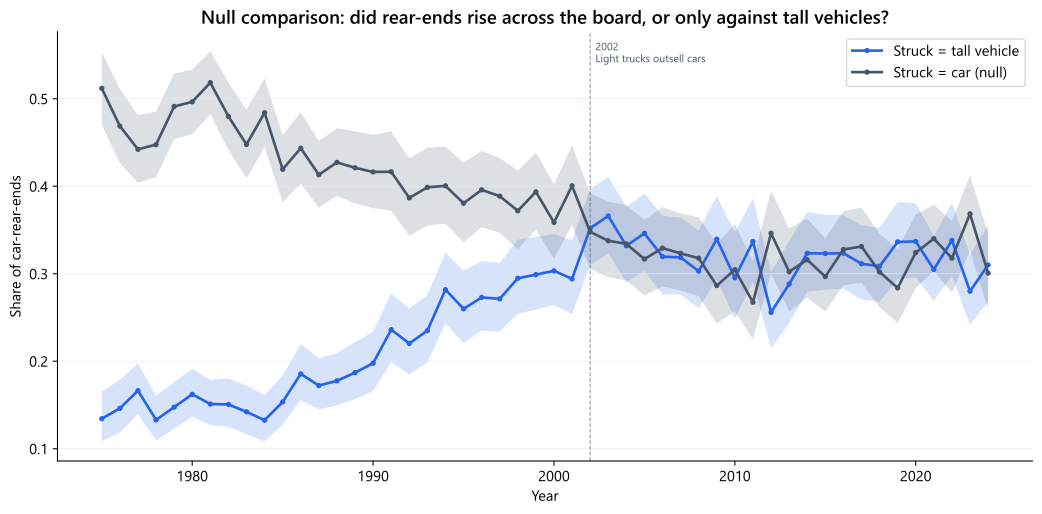
The two trends are statistically indistinguishable. A difference-in-differences (DiD) style interaction regression - which is a fancier way of saying "fit both trends together and test whether their slopes are actually different from each other" - gives a slope difference of -0.107 percentage points per year for the tall trend versus the car trend, with a 95 percent confidence interval of [-0.321, +0.107] and a p-value of 0.318. Whatever is moving rear-end shares year to year, it is moving them across the board. There is no specific signal against tall vehicles in this data.
I call it "DiD-style" rather than just "DiD" because a real difference-in-differences design needs a treatment group, a control group, and a clean intervention. I have two cohorts and a continuous year, which is the structural cousin but not the full causal-inference apparatus. The interaction term tells me the trends are not significantly different. That is enough for what I am asking it to do here.
Analysis 3: But there are more tall vehicles now, doesn't that explain it?
The obvious objection to a flat trend in Analysis 1 is that the fleet itself changed. Even with no sight-line effect at all, you would expect cars to rear-end tall vehicles more often simply because tall vehicles became more of the cars on the road. To test the hypothesis on its own terms, I have to divide out the exposure.
I took the EPA Automotive Trends Report's annual light-truck fleet share - that is, the combined share of new vehicles sold each year that were SUVs, pickups, or vans, all three counted together - and divided the Analysis 1 share by it. A ratio of 1.0 means cars rear-end tall vehicles exactly as often as the fleet would predict if every car-rear-end were independent of who was in front of you. Above 1.0 would support the sight-line story. Below 1.0 means cars rear-end tall vehicles less often than fleet composition predicts.
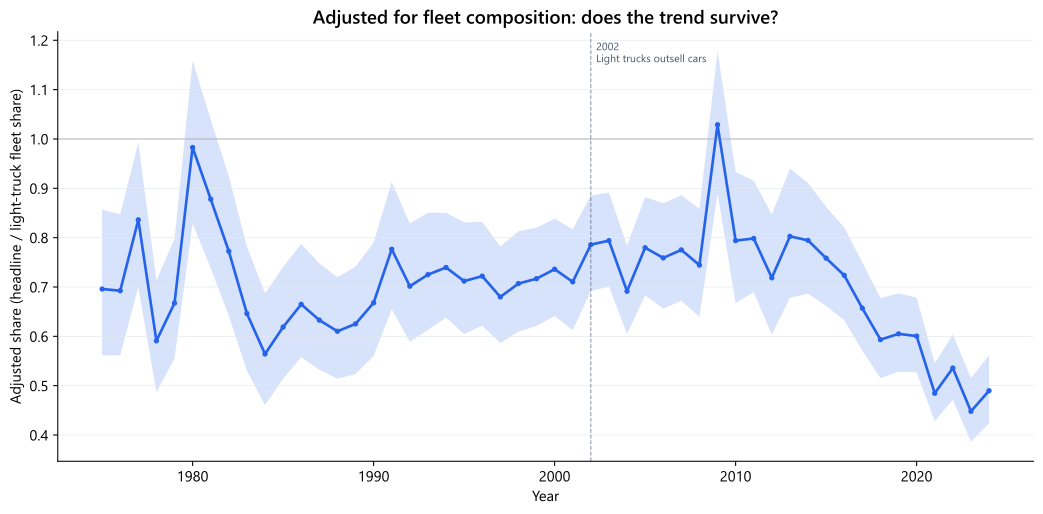
The ratio is 0.79 in 2002 and 0.49 in 2024. Cars are rear-ending tall vehicles less often than fleet composition predicts, and the gap has widened. That is the opposite direction the sight-line hypothesis predicts. Whatever effect taller vehicles have on the trailing driver's view, it is being more than compensated for by something else.
The seam to flag: EPA splits SUVs into two regulatory categories. "Truck SUVs" are four-wheel-drive SUVs or any SUV over 6,000 pounds gross vehicle weight, regulated like trucks. "Car SUVs" are two-wheel-drive SUVs below that threshold, regulated like cars. The same nameplate can land in either bucket depending on trim and drivetrain (a 2WD RAV4 and a 4WD RAV4 are different regulatory animals, for example). FARS does not make that distinction at the body-code level, so the light-truck share I am dividing by is the closest available denominator, not a pristine one. The shape of the result (a ratio below 1.0 and falling) holds up under reasonable variations in that denominator. The exact level is more sensitive.
Analysis 4: What the police wrote down
If the sight-line story were right, I would expect to see it in what the officers at the scene wrote down. FARS includes driver-related factor codes: things like "inattention," "view obscured," "following too closely." If car drivers really cannot see past taller vehicles, the share of the Analysis 1 cohort flagged for view-obscured or inattention should rise over time.
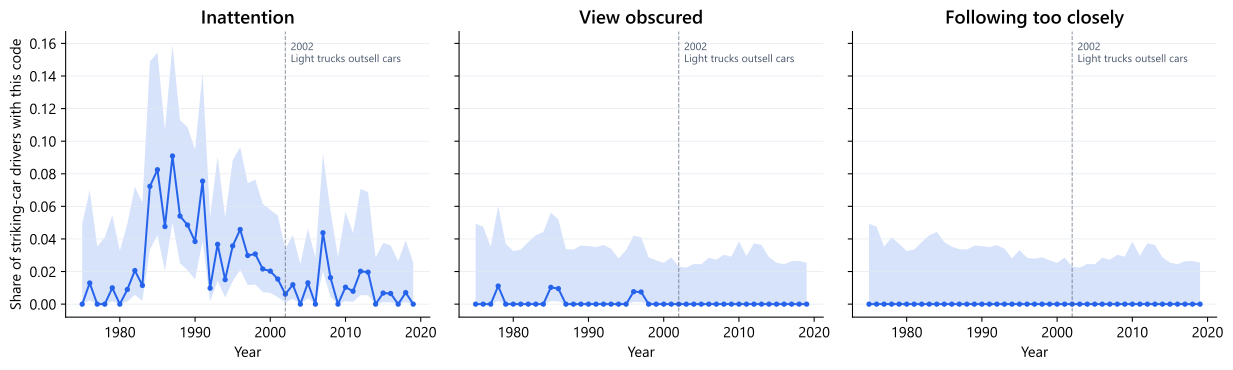
It does not, and I cannot make a strong claim either way. The factor codes are sparse: even the best-supported code in this cohort (a placeholder I am calling "inattention") sits at a mean of about 1 percent across the post-2002 years, mostly indistinguishable from the noise floor. Worse, the integer values I used for "inattention," "view obscured," and "following too closely" are placeholders pending FARS Analytical User's Manual verification. The shape of the data (sparse, noisy, no obvious trend) is real. The specific labels are best-effort and should not be quoted on their own.
I am documenting this rather than dropping the analysis. Honest negative results are part of the work. If I had a clean signal in either direction here, the post would be different. I do not, and I want a reader who comes back in a year to see exactly where the gap is.
And when these crashes did happen, they were worse
The frequency story does not hold up. The severity story is more interesting, and is where IIHS Monfort and Nolan (2019) have already done careful work I am echoing.
For two-vehicle fatal rear-end crashes between a passenger car and an SUV or pickup, you can compute the ratio of car-occupant fatalities to other-vehicle-occupant fatalities. A higher number means the car driver is paying more of the price. Monfort and Nolan showed this ratio dropped dramatically for SUVs over the last two decades, consistent with crashworthiness regulation forcing SUVs to ride lower, soften their front ends, and not over-ride sedan crumple zones.
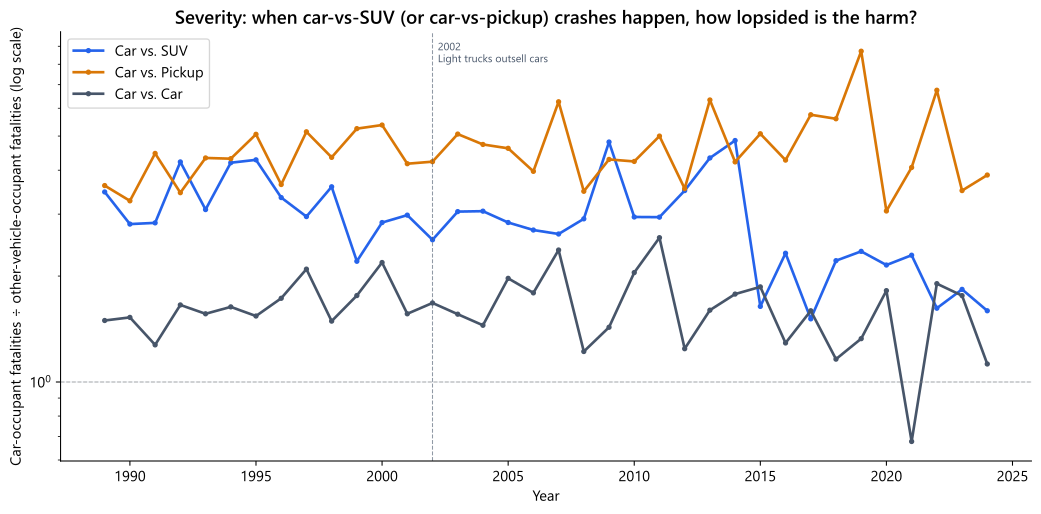
In my version of the chart, the car-vs-SUV ratio drops from about 3.29 in 1989-1992 to about 1.59 in 2024. The car-vs-pickup ratio barely moves: it sits between 3.6 and 4.9 across the entire period. Pickups have not closed the gap the way SUVs have, which is consistent with Monfort and Nolan's finding and with the regulatory observation that pickups have been less affected by the front-end and ride-height changes that softened SUVs.
Two methodology notes. First, my absolute levels run higher than Monfort and Nolan's, because I count all occupants in qualifying two-vehicle fatal rear-ends, while they used a narrower driver-only definition. The direction matches; the levels do not, by design. Second, the car-vs-car reference line sits near 1.5, not 1.0. In a fair fight between two equal-mass vehicles you would expect that ratio to hover near 1.0. The reason it does not is a FARS data convention: police reports list the "primary" or "first-involved" vehicle as VEH_NO = 1, and that vehicle systematically takes more of the fatalities. The reference line is best read as "no size mismatch," not as "perfect symmetry."
Cite: Monfort and Nolan, Traffic Injury Prevention (2019), DOI 10.1080/15389588.2019.1632442. The 2025 IIHS supersizing update extends their work into the 2017-2022 window with the same direction of finding.
What I think actually changed
The data does not support the sight-line frequency story I started with. That leaves a question worth sitting with: why did my felt experience say one thing and the numbers say another?
A few possibilities, none of which are tested in this post and all of which I would frame as "things I would investigate next" rather than findings:
- Brake lights are higher on SUVs, and a higher third brake light is in some ways more visible to a trailing driver, not less. The "I cannot see past this SUV" feeling may be about overall situational awareness while the actual stop signal may be reaching the trailing driver faster.
- Antilock brakes became standard in the 1990s, electronic stability control in the 2000s, and forward-collision warning and automatic emergency braking in the 2010s. Every one of those is a rear-end-risk reducer. They reduce risk across the board, which is consistent with what Analysis 2 shows: a flat trend rather than a rising one.
- Drivers adapt. I drove the Accord for years and developed defensive habits around tall vehicles that I never consciously named. A whole cohort of sedan drivers probably did the same. Behavior is the part of the system that is hardest to measure and is also the part that has thirty years to respond.
- The IIHS visibility decline is mostly about the SUV driver's view forward, not about the sedan driver's view past the SUV. The Honda Accord I drove still sees about 60 percent of the road. The CR-V's drop to 28 percent is the SUV driver losing visibility of pedestrians and cyclists immediately in front of them. That is a real safety problem. It is a different safety problem from the one I started this analysis on.
The closest thing to a takeaway is that the sight-line mechanism, if it exists, is being swamped by other forces in the data I can see. That does not mean it is not real. It means FARS, on its own, cannot isolate it.
Where this falls short
The honest list of limits, roughly in the order they bite:
- FARS is fatalities-only. A "rear-end crash" in this analysis is one that killed someone. The vast majority of rear-end crashes in the US do not kill anyone and are not in this data. CRSS (the police-reported sample, 2016 onward) is the natural extension. I might come back to it, but I am not committing to it here.
- Two-vehicle simplification. Analyses 1 through 5 filter to crashes with exactly two vehicles, then label them as striker and lead by FARS
VEH_NO. Pile-ups (three or more vehicles) are excluded. Those are exactly the crashes a sight-line story might predict more of, and they are sitting out of the cohort. - The body-type crosswalk has seams. FARS reorganized its body codes in 1991. I built a crosswalk to a stable scheme and verified it against the FARS Analytical User's Manual (1975-2019). The 1982-1990 era was sparse and has been backfilled. Pre-2002 data is shown for context, not for slope inference.
- Notebook 06's factor codes are placeholders. The integer values for "inattention," "view obscured," and "following too closely" need verification against the FARS manual before any of Analysis 4's specific numbers should be relied on. The shape of the result is real; the labels are best-effort.
- Methodology choices could go other ways. Counting all-occupant fatalities versus driver-only changes the level of the severity ratio (it does not change the direction). Identifying the striking vehicle by
VEH_NOrather than by primary impact point is a convenience that almost certainly misses some cases. The specific numbers would shift under different choices. The conclusions in Analyses 1 through 3 would not.
The one thing
If there's one thing I'd tell another analyst about doing this kind of project, it's run the null comparison and the exposure adjustment before you write a single word.
I had a clean headline finding from Analysis 1. The slope was slightly negative, not significant, and easy to dismiss as noise around a story I already believed. If I had written this post off that chart alone, I would have written that the data was suggestive but inconclusive, hedged a few times, and the post would still be wrong.
Analysis 2 told me the trend was not specific to tall vehicles. Analysis 3 told me cars were rear-ending tall vehicles less than fleet composition predicts. Neither was the headline. Both changed the post. The discipline of testing the null and adjusting for exposure is what kept me from publishing a story I had already decided to tell.
How this was built
I built this analysis collaboratively with Claude (Anthropic's AI assistant). The honest split:
The hypothesis is mine. So is the lived Accord-to-RAV4 experience that set it up, the analytical altitude (not academic), every design choice (cohort definition, 2002 as the threshold year, two-vehicle simplification, what to include and what to footnote), the voice rules that govern this site, every override during review (changing "thought" to "wondered if" in the title, killing the confidence-interval bands on the severity chart when they got too noisy, fixing the 2018 callout when it landed in the data line), and the call to ship as-is when something was good enough.
Claude did most of the typing. The spec doc, the implementation plan, the Python code (download, body-type crosswalk, stats helpers, notebooks, tests), the prose drafted to my direction, the FARS Analytical User's Manual research that backfilled the 1982-1990 era of the crosswalk, and the bugs caught along the way (like a wrong URL host that returned 403, or a float-drift bug in the Wilson confidence-interval formula at k = 0). The workflow was: I gave Claude the spec and a 21-step plan we built together, Claude dispatched subagents to do each task, and I reviewed every output and made every judgment call.
The hypothesis and the judgment calls are mine. The typing is mostly Claude's. How you direct an AI to do this kind of work is increasingly part of the work itself, and it is worth being clear about.
Code and data
Notebooks, helper modules, tests, and every CSV that backs a number in this post are in the companion repo at github.com/jvermaelen/cars-vs-suvs-crashes.
Glossary
FARS - Fatality Analysis Reporting System. NHTSA's annual census of every fatal traffic crash on US public roads since 1975. Free CSV/SAS bulk download from nhtsa.gov.
CRSS - Crash Report Sampling System. NHTSA's probability sample of police-reported crashes, 2016-present. The natural extension of this work to non-fatal crashes; I might come back to it later, but I am not committing to it.
IIHS - Insurance Institute for Highway Safety. Industry-funded research nonprofit. Source of the forward-visibility study and the Monfort and Nolan severity work this post leans on.
Wilson 95% CI - confidence interval for a proportion. More accurate than the textbook normal-approximation interval, especially when proportions are near 0 or 1 or sample sizes are small. Used on every year-by-year share in this analysis.
OLS - ordinary least squares. The standard linear regression method. Used here to fit a time-trend slope on yearly shares.
DiD - difference-in-differences. A causal-inference design for comparing trends across groups. I use a "DiD-style" interaction regression as a formalization of the visual null comparison in Analysis 2, not as a full causal claim.
Monfort and Nolan (2019) - IIHS researchers whose paper Pickups, SUVs, and Crash Compatibility in Traffic Injury Prevention documented the SUV-vs-car fatality ratio decline I echo in Analysis 5. DOI 10.1080/15389588.2019.1632442.
The full version with FARS field names and the body-type crosswalk lives in the repo at docs/glossary.md.